IoT System Design 4- Creating a Web Interface
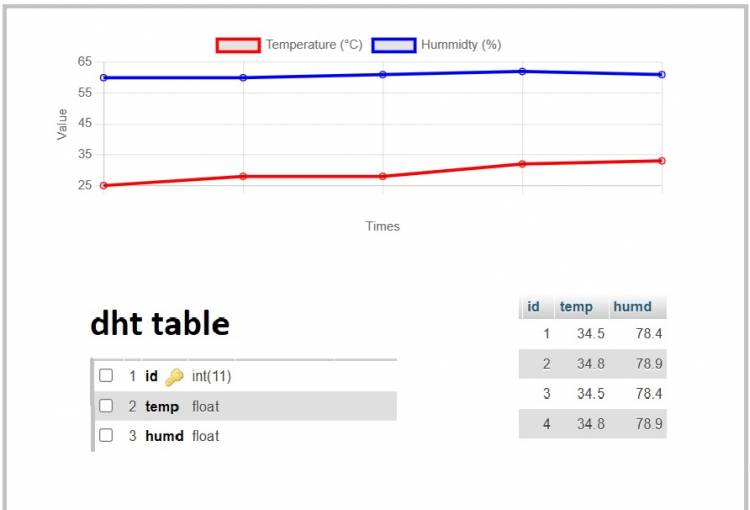
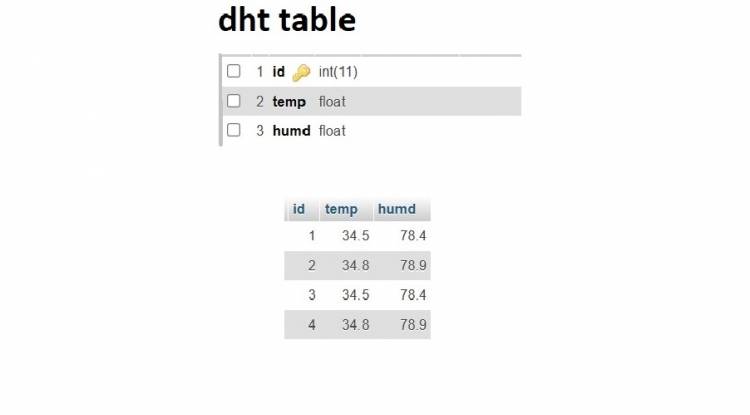
After the data from the MCU is recorded in the database, a php file is required to send this data to clients. The name of this file is fetch_data.php. This file generates data set in JSON format. This data set is an array type variable. It contains two sets of values: "temp" and "humd".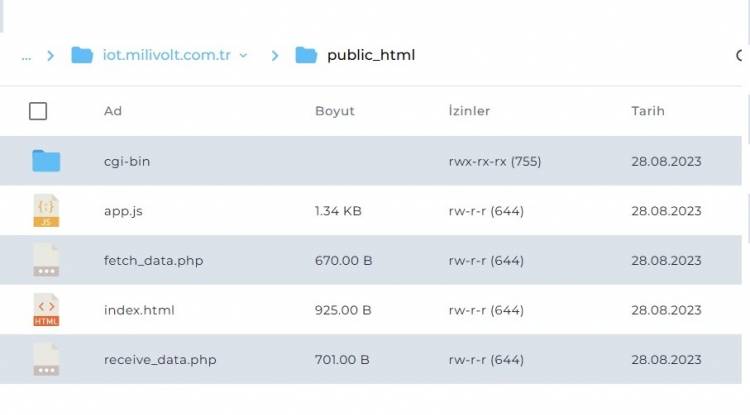
 We pull the data array in JSON format from the iot.milivolt.com.tr server and graphically transform it in the index.html file. The javascript program called app.js draws the temperature and humidity information from the database with the help of the fetch_data.php file in the background of the server and draws the graph in the index.html file.
Below is the content of the fetch_data.php file:
<?php

$servername = "localhost";

$username = "username";

$password = "123456789";

$dbname = "databasename";
$conn = new mysqli($servername, $username, $password, $dbname);

if ($conn->connect_error) {

     die("Error connecting to database: " . $conn->connect_error);

}
$sql = "SELECT * FROM dht ORDER BY id DESC LIMIT 5";

$result = $conn->query($sql);
$data = array();
if ($result->num_rows > 0) {

     while($row = $result->fetch_assoc()) {

         $data[] = array(

             "deg1" => (int)$row["temp"],

             "deg2" => (int)$row["humd"]

         );

     }

}
echo json_encode($data);
$conn->close();

?>
The app.js file content is below:
// Makes a request to the PHP file using AJAX to retrieve the data

function fetchData() {

   $.ajax({

     url: "fetch_data.php", // Write the name of your PHP file that will fetch the data here

     method: "GET",

     dataType: "json",

     success: function(data) {

       updateCharts(data);

     },

     error: function(error) {

       console.log("An error occurred while retrieving data:", error);

     }

   });

}
// Uses Chart.js to update canvases

function updateCharts(data) {

   const labels = data.map(entry => entry.timestamp);

   const deg1Values = data.map(entry => entry.deg1);

   const deg2Values = data.map(entry => entry.deg2);
   const deg1Chart = new Chart(document.getElementById("deg1Chart").getContext("2d"), {

     type: "line",

     data: {

       labels: labels,

       datasets: [{

         label: "Deg1 Values",

         data: deg1Values,

         borderColor: "blue",

         fill: false

       }]

     }

   });
   const deg2Chart = new Chart(document.getElementById("deg2Chart").getContext("2d"), {

     type: "line",

     data: {

       labels: labels,

       datasets: [{

         label: "Deg2 Values",

         data: deg2Values,

         borderColor: "green",

         fill: false

       }]

     }

   });

}
//Updates data at regular intervals

setInterval(fetchData, 3000); // pulls data every 3 seconds
Below is the content of the index.html file:
<!DOCTYPE html>

<html lang="en">

<head>

   <meta charset="UTF-8">

   <meta name="viewport" content="width=device-width, initial-scale=1.0">

   <link rel="stylesheet" href="https://stackpath.bootstrapcdn.com/bootstrap/4.5.2/css/bootstrap.min.css">

   <title>IoT Data from ard-uno-wifi esp 12f</title>

</head>

<body>

   <div class="container mt-5">

     <div class="row">

       <div class="col-md-6">

         <h2>Temperature Graph</h2>

         <canvas id="deg1Chart"></canvas>

       </div>

       <div class="col-md-6">

         <h2>Humidty Graph</h2>

         <canvas id="deg2Chart"></canvas>

       </div>

     </div>

   </div>
   <script src="https://code.jquery.com/jquery-3.5.1.min.js"></script>

   <script src="https://stackpath.bootstrapcdn.com/bootstrap/4.5.2/js/bootstrap.min.js"></script>

   <script src="https://cdn.jsdelivr.net/npm/chart.js"></script>

   <script src="app.js"></script>

</body>

</html>