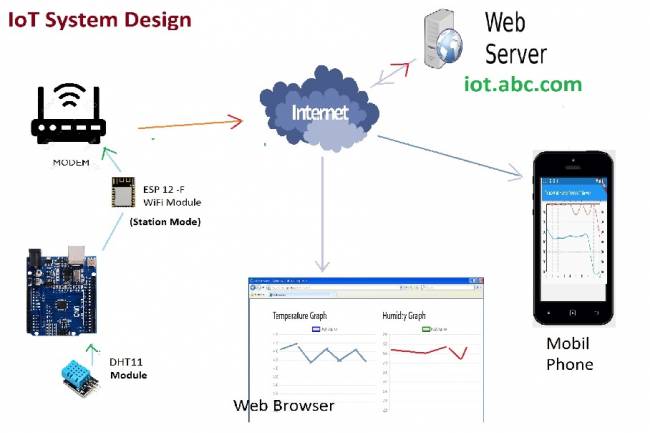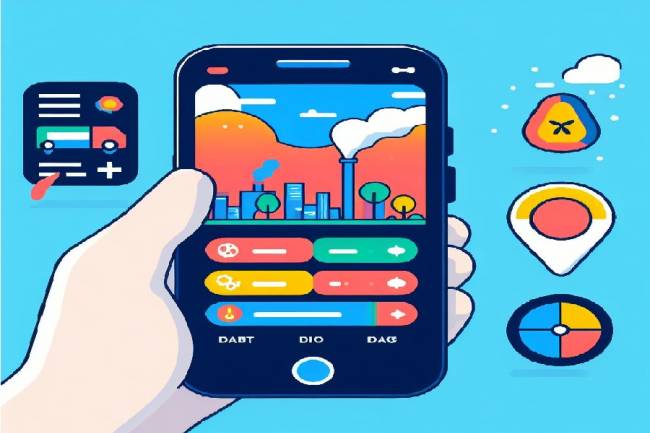
IoT System Design 5- Mobile Application Visualizing IoT Data with Flutter
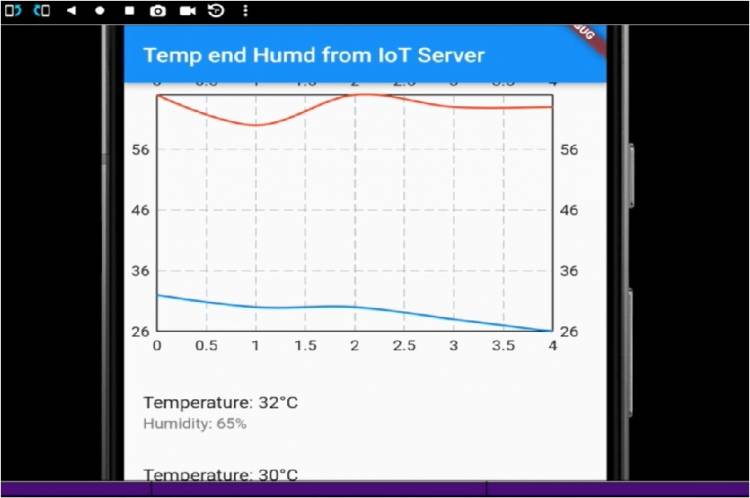
Flutter is an open source UI (User Interface) development kit developed by Google. In this article, we'll cover creating an application that pulls temperature and humidity data from an IoT device using Flutter, graphically visualizes the captured data, and displays it as a list.
You will basically need the following components to build this project:
Flutter SDK: It can be used to develop Flutter applications.
http packet: It is used to pull data from the internet.
fl_chart package: Used to create charts.
Explanation of Flutter-Dart codes:
At the beginning of the code, we import the necessary packages. The http package is used to pull data from the internet, while the fl_chart package is used to generate charts.
In the main() function, we start the application by running the MyApp widget.
The MyApp class inherits the StatefulWidget class. This means that the state of the application can be changed.
The _MyAppState class contains the actual logic of the application. This class contains the necessary methods and widgets to pull, visualize, and display data.
The initState() method is called automatically when the application is started. In this method, the fetchData() method is called and the data is pulled from the internet.
The fetchData() method uses http.get to pull data from the specified URL. When the data is successfully pulled, the JSON data is parsed and the data variable is updated.
The build() method is used to build the interface. In this method, a basic interface is created using the Scaffold widget in MaterialApp.
The LineChart widget is part of the fl_chart package and creates line charts using data.
The ListView.builder widget is used to display data as a list. A ListTile is also created for each item, displaying the temperature and humidity values.
Codes:
import 'package:flutter/material.dart';

import 'package:http/http.dart' as http;

import 'dart:convert';

import 'package:fl_chart/fl_chart.dart';
void main() {

  runApp(MyApp());

}
class MyApp extends StatefulWidget {

  @override

  _MyAppState createState() => _MyAppState();

}
class _MyAppState extends State<MyApp> {

  List<Map<String, int>> data = [];
  @override

  void initState() {

    super.initState();

    fetchData();

  }
  Future<void> fetchData() async {

    final response = await http.get(Uri.parse('http://iot.milivolt.com.tr/fetch_data.php'));

    if (response.statusCode == 200) {

      final jsonData = json.decode(response.body) as List<dynamic>;

      setState(() {

        data = jsonData.map((item) => {

          "deg1": item["deg1"] as int,

          "deg2": item["deg2"] as int,

        }).toList();

      });

    } else {

      throw Exception('Failed to load data');

    }

  }
  @override

  Widget build(BuildContext context) {

    return MaterialApp(

      home: Scaffold(

        appBar: AppBar(

          title: Text('Temp end Humd from IoT Server'),

        ),

        body: Column(

          children: [

            AspectRatio(

              aspectRatio: 1.5,

              child: LineChart(

                LineChartData(

                  titlesData: FlTitlesData(

                    leftTitles: SideTitles(showTitles: true),

                    bottomTitles: SideTitles(showTitles: true),

                  ),

                  borderData: FlBorderData(show: true),

                  gridData: FlGridData(show: true),

                  lineBarsData: [

                    LineChartBarData(

                      spots: data.asMap().entries.map((entry) {

                        final index = entry.key;

                        final value = entry.value;

                        return FlSpot(index.toDouble(), value["deg1"]!.toDouble());

                      }).toList(),

                      isCurved: true,

                      colors: [Colors.blue],

                      dotData: FlDotData(show: false),

                      belowBarData: BarAreaData(show: false),

                    ),

                    LineChartBarData(

                      spots: data.asMap().entries.map((entry) {

                        final index = entry.key;

                        final value = entry.value;

                        return FlSpot(index.toDouble(), value["deg2"]!.toDouble());

                      }).toList(),

                      isCurved: true,

                      colors: [Colors.red],

                      dotData: FlDotData(show: false),

                      belowBarData: BarAreaData(show: false),

                    ),

                  ],

                ),

              ),

            ),

            SizedBox(height: 16),

            Expanded(

              child: ListView.builder(

                itemCount: data.length,

                itemBuilder: (context, index) {

                  return ListTile(

                    title: Text('Temperature: ${data[index]["deg1"]}°C'),

                    subtitle: Text('Humidity: ${data[index]["deg2"]}%'),

                  );

                },

              ),

            ),

          ],

        ),

      ),

    );

  }

}