Extracting Data from Database and Creating Graphs with Flutter and PHP
Database Operations with Flutter
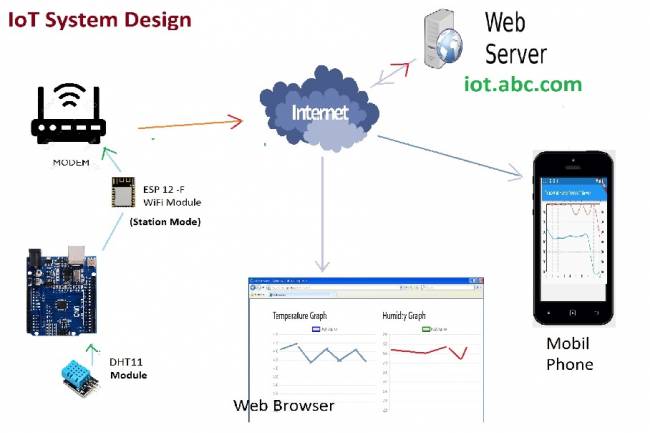
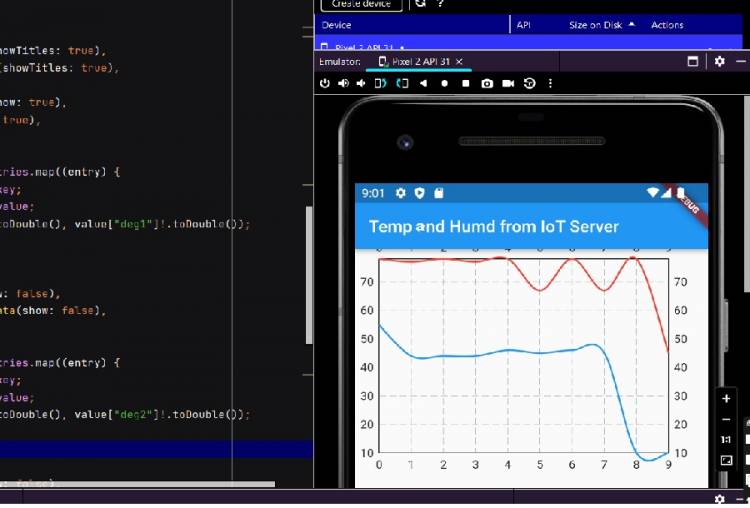
In this article, we will pull data in JSON format from a web server using Flutter and PHP and visualize this data as a line graph.
Flutter is an open source UI (User Interface) development framework developed by Google. PHP, on the other hand, is a popular programming language designed specifically for web development. Using these two technologies, we will develop an application that pulls temperature and humidity data from a database and displays this data as a line graph.
Requirements
Flutter installed development environment (Android Studio, VS Code etc.)
A web server or local server with PHP support (such as XAMPP)
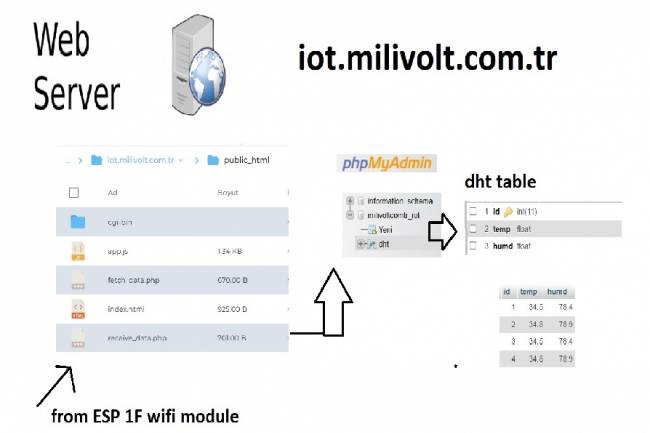
A database (e.g. MySQL)
Step 1: Data Extractions (PHP)
In the first step, we will pull the last 5 measurements from the database using PHP codes. We will return these measurements in JSON format.
<?php

$servername = "localhost";

$username = "username";

$password = "password";

$dbname = "database_name";
$conn = new mysqli($servername, $username, $password, $dbname);

if ($conn->connect_error) {

     die("Error connecting to database: " . $conn->connect_error);

}
$sql = "SELECT * FROM dht ORDER BY id DESC LIMIT 5";

$result = $conn->query($sql);
$data = array();
if ($result->num_rows > 0) {

     while($row = $result->fetch_assoc()) {

         $data[] = array(

             "deg1" => (int)$row["temp"],

             "deg2" => (int)$row["humd"]

         );

     }

}
echo json_encode($data);
$conn->close();

?>
Step 2: Developing Flutter App
In the Flutter application, we will run PHP codes using the HTTP package and process the incoming JSON data and display it as a line graph and list.
import 'package:flutter/material.dart';
import 'package:http/http.dart' as http;
import 'dart:convert';
import 'package:fl_chart/fl_chart.dart';

void main() {
  runApp(MyApp());
}

class MyApp extends StatefulWidget {
  @override
  _MyAppState createState() => _MyAppState();
}

class _MyAppState extends State<MyApp> {
  List<Map<String, int>> data = [];

  @override
  void initState() {
    super.initState();
    fetchData();
  }

  Future<void> fetchData() async {
    final response = await http.get(Uri.parse('https://iot.milivolt.news/fetch_data.php'));
    if (response.statusCode == 200) {
      final jsonData = json.decode(response.body) as List<dynamic>;
      setState(() {
        data = jsonData.map((item) => {
          "deg1": item["deg1"] as int,
          "deg2": item["deg2"] as int,
        }).toList();
      });
    } else {
      throw Exception('Failed to load data');
    }
  }

  @override
  Widget build(BuildContext context) {
    return MaterialApp(
      home: Scaffold(
        appBar: AppBar(
          title: Text('Temp end Humd from IoT Server'),
        ),
        body: Column(
          children: [
            AspectRatio(
              aspectRatio: 1.5,
              child: LineChart(
                LineChartData(
                  titlesData: FlTitlesData(
                    leftTitles: SideTitles(showTitles: true),
                    bottomTitles: SideTitles(showTitles: true),
                  ),
                  borderData: FlBorderData(show: true),
                  gridData: FlGridData(show: true),
                  lineBarsData: [
                    LineChartBarData(
                      spots: data.asMap().entries.map((entry) {
                        final index = entry.key;
                        final value = entry.value;
                        return FlSpot(index.toDouble(), value["deg1"]!.toDouble());
                      }).toList(),
                      isCurved: true,
                      colors: [Colors.blue],
                      dotData: FlDotData(show: false),
                      belowBarData: BarAreaData(show: false),
                    ),
                    LineChartBarData(
                      spots: data.asMap().entries.map((entry) {
                        final index = entry.key;
                        final value = entry.value;
                        return FlSpot(index.toDouble(), value["deg2"]!.toDouble());
                      }).toList(),
                      isCurved: true,
                      colors: [Colors.red],
                      dotData: FlDotData(show: false),
                      belowBarData: BarAreaData(show: false),
                    ),
                  ],
                ),
              ),
            ),
            SizedBox(height: 16),
            Expanded(
              child: ListView.builder(
                itemCount: data.length,
                itemBuilder: (context, index) {
                  return ListTile(
                    title: Text('Temperature: ${data[index]["deg1"]}°C'),
                    subtitle: Text('Humidity: ${data[index]["deg2"]}%'),
                  );
                },
              ),
            ),
          ],
        ),
      ),
    );
  }
}
In this article, we covered the process of pulling data from a web server and visualizing it with a line graph in a scenario where Flutter and PHP are combined. With Flutter's rich UI capabilities and PHP's database processing capabilities, you can effectively visualize your data in your mobile app.